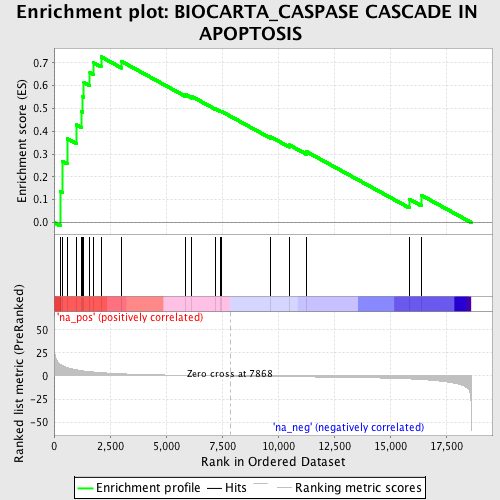
Profile of the Running ES Score & Positions of GeneSet Members on the Rank Ordered List
| Dataset | set04_transDMproB_versus_DMpreB |
| Phenotype | NoPhenotypeAvailable |
| Upregulated in class | na_pos |
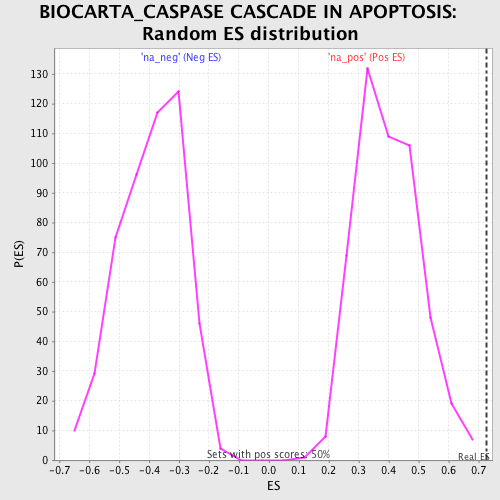
| GeneSet | BIOCARTA_CASPASE CASCADE IN APOPTOSIS |
| Enrichment Score (ES) | 0.7263454 |
| Normalized Enrichment Score (NES) | 1.8274053 |
| Nominal p-value | 0.0 |
| FDR q-value | 0.056173805 |
| FWER p-Value | 0.451 |
| PROBE | GENE SYMBOL | GENE_TITLE | RANK IN GENE LIST | RANK METRIC SCORE | RUNNING ES | CORE ENRICHMENT | |
|---|---|---|---|---|---|---|---|
| 1 | CASP4 | 284 | 12.511 | 0.1362 | Yes | ||
| 2 | CASP6 | 374 | 11.318 | 0.2684 | Yes | ||
| 3 | CASP7 | 584 | 9.126 | 0.3677 | Yes | ||
| 4 | CASP8 | 989 | 6.782 | 0.4281 | Yes | ||
| 5 | PARP1 | 1223 | 5.832 | 0.4861 | Yes | ||
| 6 | CASP2 | 1282 | 5.602 | 0.5508 | Yes | ||
| 7 | LMNB2 | 1330 | 5.435 | 0.6141 | Yes | ||
| 8 | CASP1 | 1599 | 4.688 | 0.6565 | Yes | ||
| 9 | BIRC2 | 1743 | 4.343 | 0.7013 | Yes | ||
| 10 | APAF1 | 2099 | 3.642 | 0.7263 | Yes | ||
| 11 | PRF1 | 3012 | 2.385 | 0.7062 | No | ||
| 12 | LMNA | 5879 | 0.672 | 0.5602 | No | ||
| 13 | ARHGDIB | 6150 | 0.562 | 0.5525 | No | ||
| 14 | CASP3 | 7195 | 0.204 | 0.4988 | No | ||
| 15 | GZMB | 7414 | 0.138 | 0.4887 | No | ||
| 16 | SREBF1 | 7482 | 0.116 | 0.4865 | No | ||
| 17 | DFFB | 9656 | -0.531 | 0.3761 | No | ||
| 18 | LMNB1 | 10499 | -0.766 | 0.3401 | No | ||
| 19 | BIRC3 | 11275 | -0.979 | 0.3103 | No | ||
| 20 | CASP9 | 15860 | -3.149 | 0.1019 | No | ||
| 21 | DFFA | 16392 | -3.819 | 0.1196 | No |